Use Time Series Request to request data over a specific period, defined by a start date, end date, and frequency of data
Through the add-in data extraction can be performed in different ways depending on the needs of the analysis.
A time series request is conducted by filling out each space in the dialog box below.


Date format: dd/mm/yuy or as a relative date from today. For example, -2Y for 2 years agi from today

A set of static datatypes can be selected to display as the column headings.
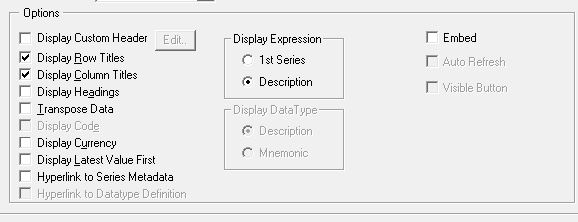
Row Titles
Displays the series code at the left of each series.
Column Titles
Displays the datatype mnemonic or expression at the top of the column for each datatype.
Headings
Displays a general heading for row and column headings. For example, the date of the request
Currency
Displays the traded currency for each selected series.
Expression
Display the first series mnemonic or description.
Transpose
Displays the series data in rows instead of columns.
Display Latest Value First
Displays the most recent value first
Embed
The request is embedded as a dynamic, refreshable object when saved. If this is not selected, the results cannot be refreshed.
Auto Refresh
Refreshes the request automatically when you open the spreadsheet.
Visible button
Displays the Refresh button with the request results. You can use the Request Manager to refresh requests.
Series Metadata
Adds a hyperlink to the series code to link to the classifications and metadata pages from Navigator for the series (also enable series that are now dead or inactive to be identified in your workbook).
Hyperlink to Datatype Definition
Add links to the datatype to display the definition from Navigator.
You can submit DFO (Datastream for Office) formula in the Excel sheet:
DSGRID Formula syntax:

Notes:
|
Start date |
String in formula |
|
Intraday Value |
TODAY |
|
Latest Value |
LATEST VALUE |
|
Base Date |
BDATE |
|
Start of Week |
SWDATE |
|
Start of Month |
SMDATE |
|
Start of Quarter |
SQDATE |
|
Start of Year |
SYDATE |
Notes:
|
Option |
String in formula |
|
Custom Header (applicable for Time Series request) |
CustomHeader=true;CustHeaderDatatypes=DATATYPE; |
|
Row Header |
RowHeader=true; |
|
Column Header |
ColHeader = true; |
|
Heading |
Heading = true; |
|
Transpose |
Transpose = true; |
|
Display Code |
Code=true; |
|
Currency |
Curn = true; |
|
Display Latest Value First (applicable for Time Series request) |
LatestFirstValue=true; |
|
Hyperlink to Series Metadata |
SeriesMetaDataLink = true; |
|
Hyperlink to Datatype Definition |
DataTypeDefLink = true; |
|
Display Expression |
DispSeriesDescription = true; |
|
Display Datatype |
DispDatatypeDescription = true; |
|
TS Format (applicable for Time Series request and also you need to select Frequency as Quarterly or Yearly to use this option.) |
YearlyTSFormat=false;QuarterlyTSFomat=true |
|
Embed Formula |
|
|
|
|
Not Available String Overriding |
NotAvailableString=N/A; |
|
Set the number of datatypes to send to the servers – where N is the number (use M:N in the Request Table Request format option) |
MaxConfigSnapshotRequests=N |
Search examples:
Static request:
=DSGRID("DK:LUN";"INDX;CEXT;ISIN;LOC;SECD;NAME;MNEM";"Latest Value";"";"";"RowHeader=true;ColHeader=true;DispSeriesDescription=true;DispDatatypeDescription=true";"")
Time Series request:
=DSGRID("@MSFT,@AAPL";"P;MV;DY;PE";"2010-01-01";"2015-12-31";"Q";"RowHeader=true;ColHeader=true;DispSeriesDescription=false;YearlyTSFormat=false;QuarterlyTSFormat=false";"")